
Setup Your Bid Strategies on Autopilot
Once your Amazon Ads data has synced, BookBidder gives you a clear view of your campaign performance and tools to optimize your bids without constant manual effort.
Understanding Your Dashboard
Your BookBidder dashboard is the central hub for everything happening across your Amazon Ads campaigns. Here's what you'll see:
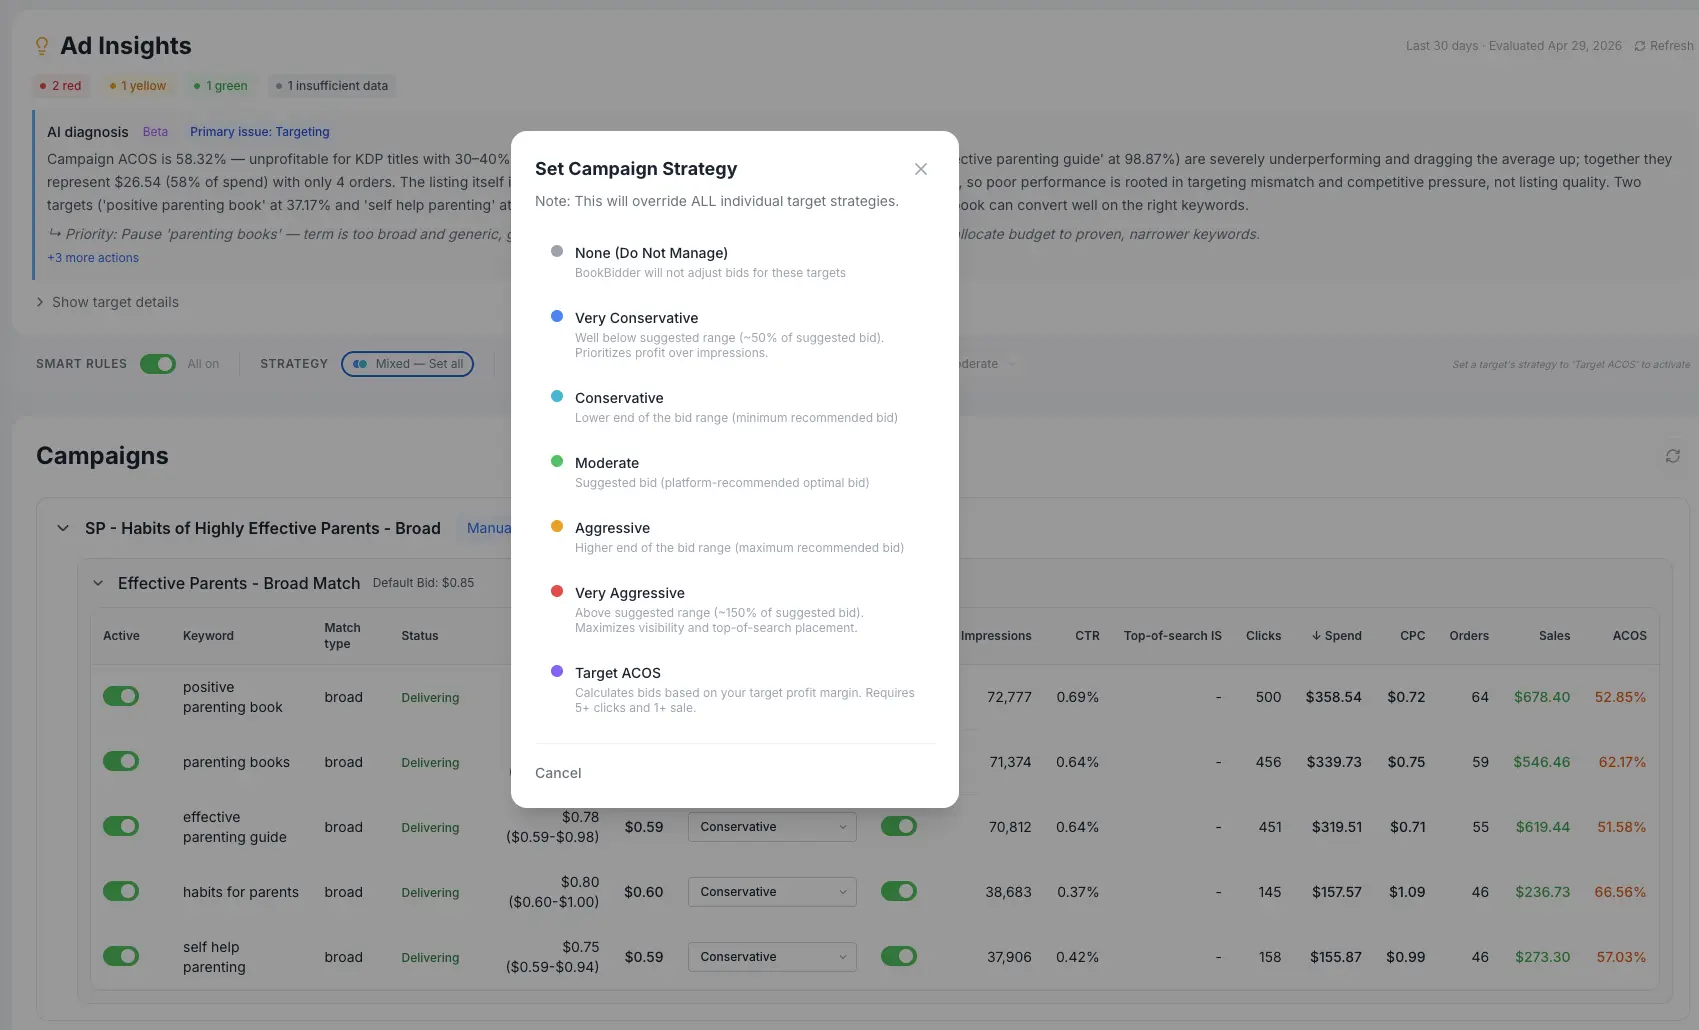
Campaign overview: All your Sponsored Products campaigns listed with key metrics: ACoS, total spend, impressions, clicks, and orders. You can sort by any column to quickly find what needs attention.
Drill-down views: Click into any campaign to see its ad groups, keywords, product targets, and search terms with performance data for each. This is where you'll spot the specific keywords burning your budget or driving your best sales.
Marketplace filter: If you advertise in multiple markets, you can switch between them to see how your campaigns perform in each region. A keyword that converts well in the US might be losing money in the UK, so checking each marketplace matters.
Key Metrics to Watch
ACoS (Advertising Cost of Sales): The percentage of your ad revenue spent on ads. Lower is better. For most KDP authors, keeping ACoS under your royalty rate means your ads are profitable. For example, if your royalty is 35%, an ACoS under 35% means you're earning more than you spend.
Spend with zero orders: Campaigns or keywords spending money without generating sales. These are your top candidates for pausing or negating.
Impressions and CTR: Low impressions may mean your bids are too low to win auctions. A low click-through rate may mean your book cover or ad copy needs work, not your bid strategy.
Setting Up Automated Optimization
BookBidder's real power comes from combining your dashboard insights with automation. Here's the recommended setup flow:
Step 1: Review your campaigns. Spend 10-15 minutes looking at your dashboard. Sort by ACoS and by spend to identify your best and worst performers. Note any patterns: are certain ad groups consistently unprofitable? Are specific search terms eating your budget?
Step 2: Enable Smart Rules. Based on what you see, set up rules to handle the repetitive cleanup automatically. See the Smart Rules guide for step-by-step instructions and recommended rule templates.
Step 3: Let Ad Insights monitor the results. After your Smart Rules have been running for a week, check your Ad Insights report to see if problem areas are improving. The green/yellow/red flags will show you whether your rules are having the right effect.
Step 4: Refine and repeat. Optimization isn't a one-time setup. Check your dashboard weekly (or just read your Monday email summary) to see what's changed, and adjust your Smart Rules as your campaigns evolve.
Tips for Getting the Most Out of Your Dashboard
- Sort by "Spend" descending to see where most of your money goes. Start your optimization there since small percentage improvements on high-spend campaigns have the biggest impact.
- Use the search term view to find irrelevant terms triggering your ads. If you sell a fantasy novel and see search terms for "fantasy football," that's a clear candidate for a negative keyword.
- Don't ignore paused campaigns. Sometimes a paused campaign was turned off prematurely and still holds valuable keyword data you can learn from.